Community Reports
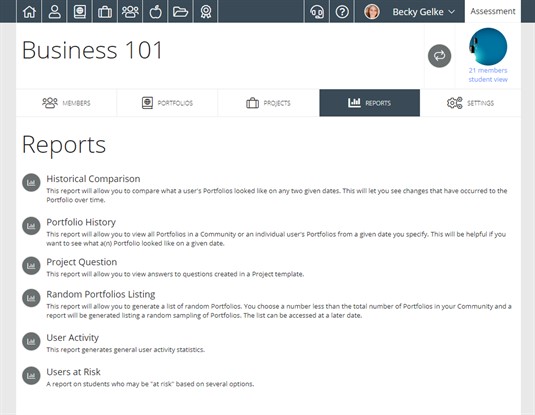
There are currently six types of reports for your community: Historical Comparison, Portfolio History, Project Question, Random Portfolios Listing, User Activity, and Users at Risk. Each one of these reports gives you a tool for analyzying community member performance and development.
Finding Reports
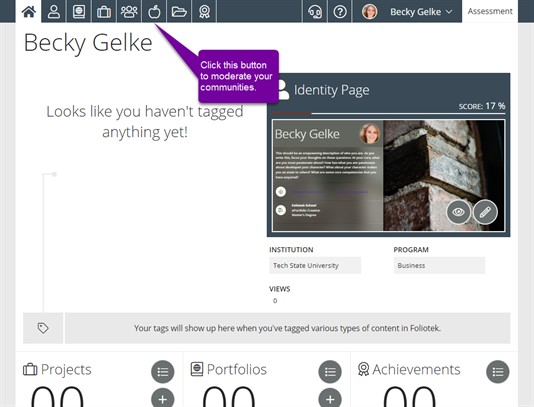
First you will need to go to the moderate communities page. Click on the Moderator icon.
Next, choose the community you want to run reports on.
Once you have choosen a community you will be taken to the page where you can moderate your community. Click on the Reports tab. Here you will see all the reports available to you along with a description of each.
Historical Comparison Report
This report allows you to compare a user's portfolio on two different dates. This will be a great tool to see a students progress over a period of time.
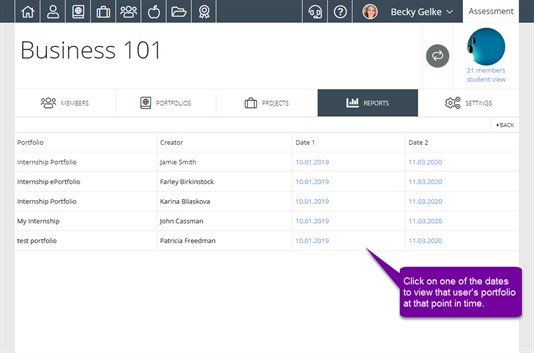
First click on Historical Comparison. Choose your comparison dates and, optionally, add a user. If you do not enter anything in the User box, all members of the community will be listed in the report. Then click on Generate Report. The result will list all portfolios shared during that time period. Click on one of the dates to view the portfolio as of that date.
Portfolio History Report
This report will allow you to view all portfolios in a given community or an indiviual user's portfolios from a given date you specify. This will be helpful if you want to see what a portfolio looked like on a given date.
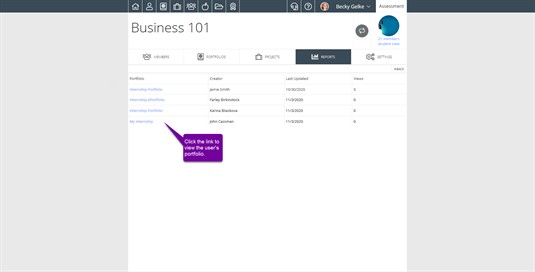
First click on Portfolio History. Next, you will need to enter a date and, optionally, an email address for a student's account in order to look up a specific student. If you want to see all students in the community, don't enter anything in the User box. Once you enter this information, you will need to click on the checkmark button to generate the report. The final report will look like this:
Project Question Report
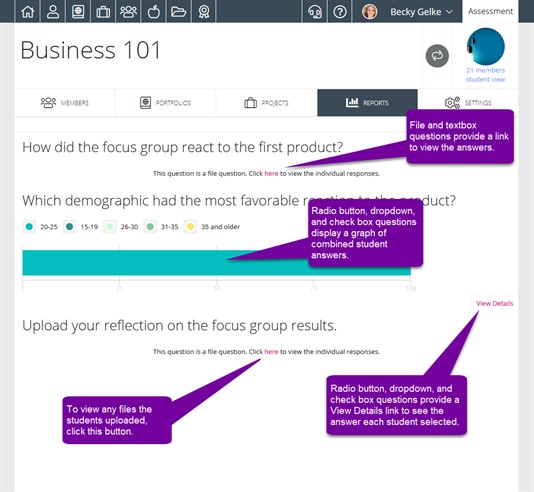
This report will allow you to view the answer breakdown for any questions you added to the Instructions area of a project template. First, click on Project Question. Now, choose the template from the dropdown list and then click Generate Report. In the report, you will see a breakdown of any questions you have asked. For radio button, dropdown, and check box questions, the View Details button allows you to see the answers provided by each student .
Random Portfolio Listing Report
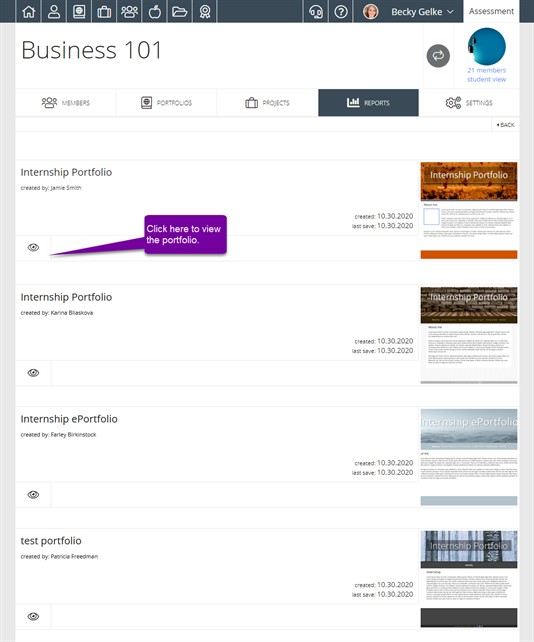
This list allows you to generate a list of random portfolios that you can look over, or compare to other students. You can also export the generated portfolios and access the data at a later time.
First click on Random Portfolio Listing. Now, will fill out the number of portfolios you want compiled. You will want to enter a number that is less then the total number of members you have in your community. Click on the eyeball button in the lower left that portfolio.
User Activity Report
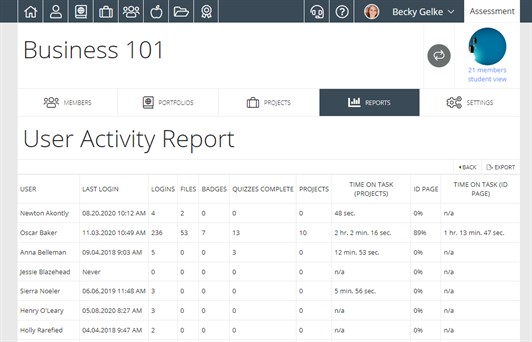
The User Activity report displays
valuable information on the activities students have been working
on. It shows the completion of some basic student activity,
such as files uploaded, logins, ID page completion, badges earned,
quizzes completed, and projects created. Click on
User Activity to access the report. Then,
select the program you wish to run the report on and click
Generate Report.
Users at Risk Report
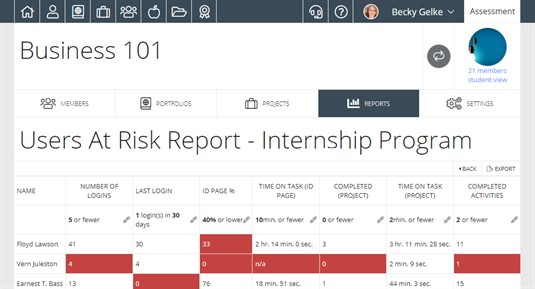
The Users at Risk report uses a specially designed algorithm combining number of logins, last login date, id page completion, projects created, activities completed, and time on task to identify students who are at risk of not being successful. Click on Users at Risk to access the report. Next, select the program you are interested in and click Generate Report.
